
RaspberryPi NSM

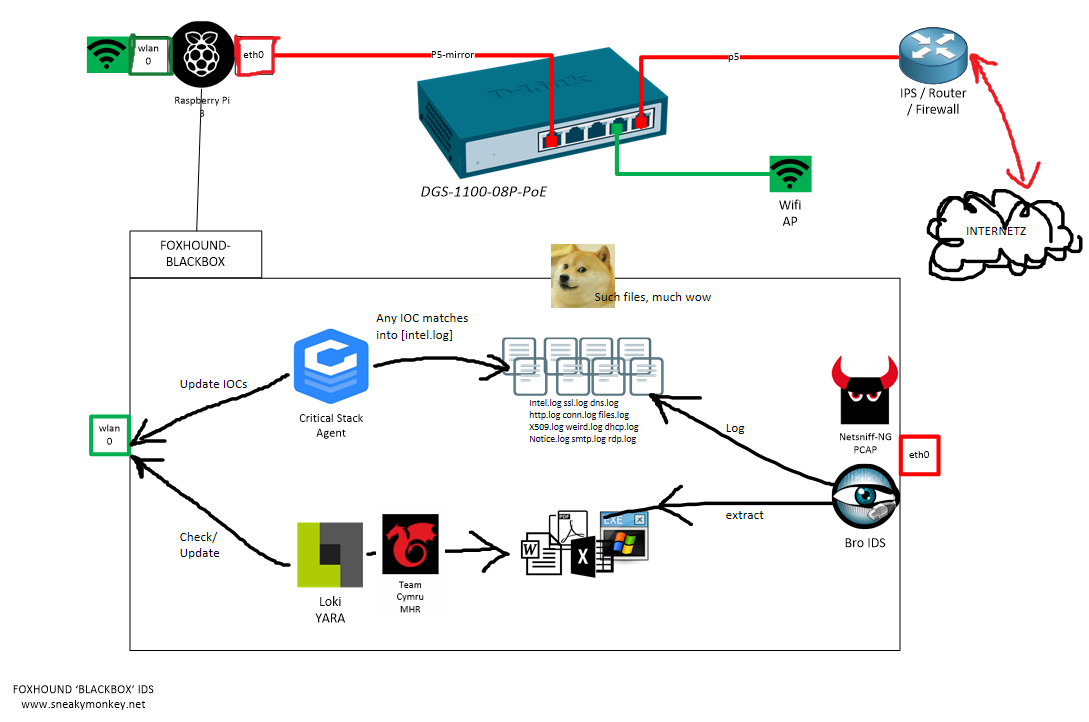
Foxhound: Blackbox - A RaspberryPi 3 NSM (Network Security Monitor) based on Bro, Netsniff-NG, Loki and Critical Stack.
Suitable for a home 'blackbox' deployment - it will record everything that happens on your network. Use it to detect threats and/or to provide network forensics to a malware lab. Primarily I've used this over the last few months to learn more about Bro.
If your looking for something more suitable for the enterprise look at Security Onion.
Original concept Sweet Security by Travis Smith over at Tripwire.
Shopping list
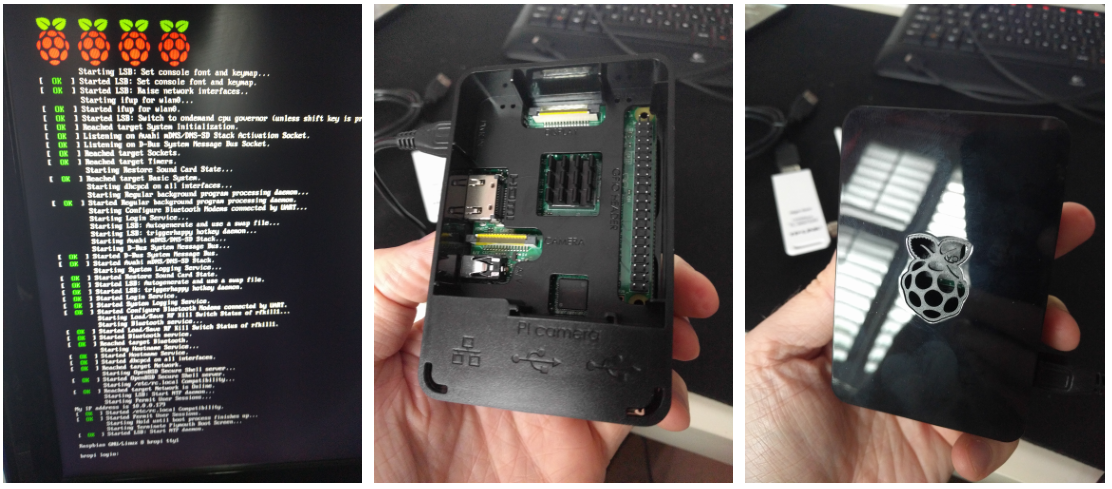
- Raspberry Pi 3 (case, power, pi board)
- Class 10 microSD card 64Gb (80Mb/s) Sandisk.
- Linux Raspbian Lite Debian OS.
- NetGear Gigabit Switch or similiar that supports port mirroring. In my case I used a PoE D-Link 1100-08P as it powers my IoT Mirai botnet.
- Critical Stack API for Threat Intel / IOCs.
- Mailgun Account or similar mail service for alerts/notifications.
Total ~£75
Overview
Key Tech
- What is Port Mirroring?
To replicate the traffic in one port to another (passively). Cheaper then a tap but will put load on the switch.
- What is Bro?
IDS Protocol analyser. Think of it as Wireshark's protocol analyser but without the GUI and much faster.
- What is Netsniff?
Packet capturing daemon that utilises AF-packet processing to speed up the capture process. FPC (Full packet capture) is the ultimate source to an analyst "PCAP it, or it didn't happen".
- What is LOKI?
File scanning daemon based on YARA. For signature detection much like AV but you can write the custom rules for detection. See Florian Roth's Yara repo or Yara-rules repo
- What is Critical Stack?
Threat Intelligence on a shoe-string budget. Log in, set some feeds to follow and link it to the Pi using the API.
- What is Team Cymru MHR ?
Malware Hash Registry. Checks the file hash against a database of known bad and will report back on last seen and AV detection. Enabled in Bro by default.
Building

- Flash base OS onto Pi.
- Give the Pi an IP.
- Run bash script.
- Done.
1. Flashing Raspbian onto the microSD card
Flash Raspbian onto microSD. I used my MacBook so methods may differ. See Raspbian Lite Imaging for further details.
Insert microSD card
diskutil list
Find the disk number.
diskutil unmountDisk /dev/disk<disk# from diskutil>
Flash the Raspbian image onto the microSD card 'disk'
sudo dd bs=1m if=image.img of=/dev/rdisk<disk# from diskutil>
Unmount once finished
diskutil unmountDisk /dev/disk<disk# from diskutil>
2. Configuring the network
Login using the defaults. User: pi Password: raspberry
Set IP wifi on wlan0 for your trusted management access.
sudo nano /etc/wpa_supplicant/wpa_supplicant.conf
network={
    ssid="The_ESSID_from_earlier"
    psk="Your_wifi_password"
}
sudo ifdown wlan0
sudo ifup wlan0
ifconfig wlan0
Once you have received a DHCP IP, you can SSH in from this point.
Leave eth0 as your monitoring interface. This does not need an IP address.
(whatever text editor you prefer)
sudo apt-get update && sudo apt-get -y install vim
sudo vim /etc/network/interfaces
Add/edit the following lines
iface eth0 inet static
static ip_address=0.0.0.0
Restart the interface eth0
sudo ifconfig eth0 down && sudo ifconfig eth0 up
3. Deployment
Download and run the bash script. Interrogate it and copy it as you wish. Tested on Raspbian
- Installs the core set of programs
- Configures network options (disables NIC offloading etc)
- Creates the services for each program.
- Creates the email alerts using Mailgun/SSMTP
- Configures cron jobs.
pi@foxhound:~# sudo su -
root@foxhound:~# apt-get install -y git
root@foxhound:~# cd ~
root@foxhound:~# git clone https://github.com/sneakymonk3y/foxhound-nsm.git
root@foxhound:~# chmod +x foxhound-nsm/foxhound.sh
root@foxhound:~# ./foxhound-nsm/foxhound.sh
Done! Cookie approved!

Whats next? - Hook it up like in the diagram if you haven't already and you should be seeing data coming in. All services should be active once the script has finished.
Performance
TCPReplay a PCAP.
Spam the monitor port eth0 some pcap data. I used some pre-captured traffic.
pi@foxhound:~ $ sudo tcpreplay -t -K -q --loop=10 --intf1=eth0 /opt/foxhound-1476541443.pcap
Actual: 1048570 packets (1050923190 bytes) sent in 87.62 seconds.		Rated: 11994102.0 bps, 91.51 Mbps, 11967.25 pps
Before and after broctl netstats
root@foxhound:/etc/network# broctl netstats
        bro: 1476547903.768150 recvd=1951368 dropped=5408 link=1956776

root@foxhound:/etc/network# broctl netstats
        bro: 1476548144.248161 recvd=3012168 dropped=14608 link=3026776
for home/lab use the IDS performs adequately well - its dropped 10,000 packets after receiving nearly 1,000,000! My broadband speed is 40 Mbps which is perfectly fine for the IDS to cope with. If you need extra performance, avoid running it on a Raspberry Pi and look into caching mechanisms such as NTOP's PFRING/ZC modules which come shipped with Security Onion.
For more NIC perf tests, on a server run
mark@ubuntu:~$ sudo apt install iperf3
mark@ubuntu:~$ iperf3 -s
-----------------------------------------------------------
Server listening on 5201
-----------------------------------------------------------
then on the Pi run
root@foxhound:~# apt install iperf3
root@foxhound:~# iperf3 -c 10.0.0.7 -i 1 -t 20
Connecting to host 10.0.0.7, port 5201
[  4] local 10.0.0.180 port 38562 connected to 10.0.0.7 port 5201
[ ID] Interval           Transfer     Bandwidth       Retr  Cwnd
[  4]   0.00-1.00   sec  8.86 MBytes  74.3 Mbits/sec    0   89.1 KBytes
...
...
...
[  4]  19.00-20.00  sec  9.26 MBytes  77.7 Mbits/sec    0   1.23 MBytes
- - - - - - - - - - - - - - - - - - - - - - - - -
[ ID] Interval           Transfer     Bandwidth       Retr
[  4]   0.00-20.00  sec   185 MBytes  77.5 Mbits/sec  139             sender
[  4]   0.00-20.00  sec   184 MBytes  77.1 Mbits/sec                  receiver

iperf Done.
I assume the bottleneck here is the microSD card which runs at ~80MB/s.
Bro Basics
- Default storage of all Bro logs are /nsm/bro/logs/
- Default scripting location is /usr/local/bro/share/bro/site/bro-scripts/
Log directory should look something like...
pi@foxhound:/nsm/bro/logs/current $ ls -lash
total 6.9M
4.0K drwxr-xr-x 3 root root  4.0K Oct 15 16:11 .
4.0K drwxr-xr-x 5 root staff 4.0K Oct 15 16:50 ..
4.0K -rw-r--r-- 1 root root   349 Oct 15 16:51 app_stats.log
4.0K -rw-r--r-- 1 root root   121 Oct 15 15:51 .cmdline
 16K -rw-r--r-- 1 root root   14K Oct 15 16:30 communication.log
2.9M -rw-r--r-- 1 root root  2.9M Oct 15 16:52 conn.log
 16K -rw-r--r-- 1 root root   14K Oct 15 16:52 dhcp.log
384K -rw-r--r-- 1 root root  379K Oct 15 16:52 dns.log
4.0K -rw-r--r-- 1 root root   345 Oct 15 15:51 .env_vars
1.2M -rw-r--r-- 1 root root  1.2M Oct 15 16:52 files.log
1.6M -rw-r--r-- 1 root root  1.6M Oct 15 16:52 http.log
4.0K -rw-r--r-- 1 root root   291 Oct 15 16:44 known_hosts.log
4.0K -rw-r--r-- 1 root root   327 Oct 15 16:34 known_services.log
 12K -rw-r--r-- 1 root root   11K Oct 15 16:50 notice.log
4.0K -rw-r--r-- 1 root root     5 Oct 15 15:51 .pid
4.0K -rw-r--r-- 1 root root    18 Oct 15 16:00 .rotated.communication
4.0K -rw-r--r-- 1 root root    18 Oct 15 16:00 .rotated.conn
4.0K -rw-r--r-- 1 root root    18 Oct 15 16:01 .rotated.conn-summary
4.0K -rw-r--r-- 1 root root    18 Oct 15 16:00 .rotated.dhcp
4.0K -rw-r--r-- 1 root root    18 Oct 15 16:00 .rotated.dns
4.0K -rw-r--r-- 1 root root    18 Oct 15 16:00 .rotated.files
4.0K -rw-r--r-- 1 root root    18 Oct 15 16:00 .rotated.http
4.0K -rw-r--r-- 1 root root    18 Oct 15 16:00 .rotated.known_hosts
4.0K -rw-r--r-- 1 root root    18 Oct 15 16:00 .rotated.known_services
4.0K -rw-r--r-- 1 root root    18 Oct 15 16:00 .rotated.loaded_scripts
4.0K -rw-r--r-- 1 root root    18 Oct 15 16:00 .rotated.notice
4.0K -rw-r--r-- 1 root root    18 Oct 15 16:00 .rotated.packet_filter
4.0K -rw-r--r-- 1 root root    18 Oct 15 16:00 .rotated.software
4.0K -rw-r--r-- 1 root root    18 Oct 15 16:00 .rotated.ssl
4.0K -rw-r--r-- 1 root root    18 Oct 15 16:00 .rotated.weird
4.0K -rw-r--r-- 1 root root    18 Oct 15 16:00 .rotated.x509
4.0K -rw-r--r-- 1 root root  3.0K Oct 15 16:51 software.log
320K -rw-r--r-- 1 root root  314K Oct 15 16:52 ssl.log
4.0K -rw-r--r-- 1 root root    58 Oct 15 15:51 .startup
4.0K drwx------ 3 root root  4.0K Oct 15 15:51 .state
4.0K -rwx------ 1 root root    18 Oct 15 15:51 .status
4.0K -rw-r--r-- 1 root root    46 Oct 15 15:51 stderr.log
4.0K -rw-r--r-- 1 root root   188 Oct 15 15:51 stdout.log
 24K -rw-r--r-- 1 root root   17K Oct 15 16:52 weird.log
416K -rw-r--r-- 1 root root  412K Oct 15 16:52 x509.log
Use head to provide you with the field names
pi@foxhound:$ head  dns.log
#separator \x09
#set_separator	,
#empty_field	(empty)
#unset_field	-
#path	dns
#open	2016-10-15-16-00-01
#fields	ts	uid	id.orig_h	id.orig_p	id.resp_h	id.resp_p	proto	trans_id	query	qclass	qclass_name	qtype	qtype_name	rcode	rcode_name	AA	TC	RD	RA	Z	answers	TTLs	rejected
#types	time	string	addr	port	addr	port	enum	count	string	count	string	count	string	count	string	bool	bool	bool	bool	count	vector[string]	vector[interval]	bool
using bro-cut to parse the logs
pi@foxhound:$ cat dns.log | bro-cut -D ts id.orig_h id.orig_p id.resp_h id.resp_p proto query answers TTLs
basic report
pi@foxhound:$ bro-cut query < dns.log | sort | uniq -c | sort -rn | head -n 10
For more excellent examples, try the official Bro exercises over at Bro.org. If your pretty handy with GREP, AWK and SED you'll kickass here.
Tail DNS.log and then generate some DNS traffic from a client.
tail -f dns.log | awk '{print $3, $7, $9}'
Also note, MaxMind GEOIP lookups is enabled only on the conn.log
pi@foxhound:$ bro-cut resp_cc < conn.log | sort | uniq -c | sort -rn | head -n 10
    755 US
    524 RO
    123 GB
     49 NL
     28 EU
     25 IE
     10 DE
      7 ES
      6 CA
I've not created any dashboarding but you could spin up a VPS ELK instance and ship the logs securely to the cloud if you didn't fancy building one from scratch. Otherwise I'd recommend you build one locally using ELK/Splunk/Graylog.
Basic Maintenance
stop/start netsniff-ng
pi@foxhound:~ $ sudo service netsniff-ng stop
pi@foxhound:~ $ sudo service netsniff-ng start
pi@foxhound:~ $ sudo service netsniff-ng status
stop/start/network statistics bro
pi@foxhound:~ $ sudo -i broctl stop
pi@foxhound:~ $ sudo -i broctl start
pi@foxhound:~ $ sudo -i broctl netstats
pi@foxhound:~ $ sudo -i broctl status
Running Loki manually
root@foxhound:~ $ python /nsm/Loki/loki.py --noprocscan --dontwait --onlyrelevant -p /nsm/bro/extracted -l /nsm/Loki/log
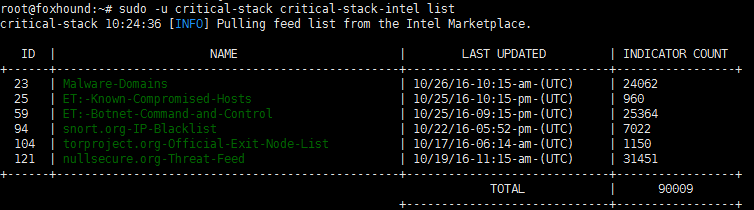
Check Critical Stack IOCs, this periodically checks in via the cron script.
root@foxhound:~ $ sudo -u critical-stack critical-stack-intel list
Further Research
Pretty open ended but easily built upon. Just a few ideas...
- Dashboarding with ELK/Splunk FREE version / Graylog
- Graphing/Mapping with D3js
- Local NMAP scanning
- Snort/Suricata IDS Support
- Virus Total integration
- Google Stenographer PCAP
- AOL Moloch PCAP
- PassiveDNS , though Bro's dns.log and filtering can offer the same capabilities.
- Laika BOSS: Object Scanning System
Reading